Debug Console – Arma 3
![]() 0.54
Configuration in Take On Helicopters differs, Mission Editor: Debug Console (Take On Helicopters)
0.54
Configuration in Take On Helicopters differs, Mission Editor: Debug Console (Take On Helicopters)
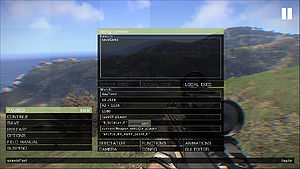
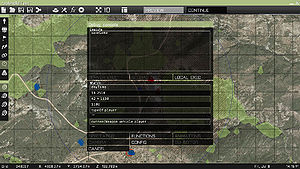
Debug Console is an editing tool giving designer ability to check various states and execute custom code on fly.
Access
While playing a mission from the editor, the console is immediately available in pause menu. In old 2D editor map screen, you can open in by clicking on "Debug Console" button or using Ctrl+D shortcut. In Eden editor it is available under Tools -> Debug Console.
Configuration
The console is automatically available in missions running from editor. If mission designer wishes to enable it elsewhere, he can achieve it in in one of the 3 ways:
- Using following Description.ext param:
enableDebugConsole = 1;
Possible values:
0 - Default behavior, available only in editor
1 - Available in SP and for hosts / logged in admins in MP
2 - Available for everyone
- Using Eden attribute Debug Console, available in Attributes -> General -> States -> Debug Console
- Using mission config param. You can add "\a3\functions_f\Params\paramDebugConsole.hpp" mission parameter, where server host / admin can choose whether or not he'll allow debug console.
Order of Precedence
- mission parameter | Mission param is checked
- [[description.ext] param is checked
- Eden attribute is checked
BattlEye Filters
Debug Console uses Remote Execution. If you wish to exclude Debug Console execution from BE Filters, add this to your remoteexec.txt
!"bis_fnc_debugconsoleexec \[[0-2],\{.*\}\]"
Features
- Expression field
- Value is saved when console is closed and restored again upon return
- The expression can be executed by one of the following buttons:
- Local - execute on player's computer using remoteExec to call given code.
- Global - execute on all computers using remoteExec to call given code. Enabled only in MP
- Server - execute on server only using remoteExec to call given code. Enabled only in MP
- Performance Test - See: BIS_fnc_codePerformance
- 4x Watch field
- Value is saved when console is closed and restored again upon return
- When code is taking too long to evaluate (>0.003s), the background turns orange and the value is not saved
- Buttons (all of the close the pause menu and open some another window)
- Spectator camera
- Splendid Camera
- Functions viewer
- Config Viewer
- Animation viewer
- User Interface Editor
Profile Saving
The debug console automatically saves each field as you go, Even after game restart. These can also be access using profileNamespace getVariable with the following code:
- Expression Field
profileNamespace getVariable "rscdebugconsole_expression";
- 4x Watch Field
profileNamespace getVariable "rscdebugconsole_watch1";
profileNamespace getVariable "rscdebugconsole_watch2";
profileNamespace getVariable "rscdebugconsole_watch3";
profileNamespace getVariable "rscdebugconsole_watch4";
Using the same variables you can also clear or change the fields.


